
Lottery Valley ranks 57 of 57 active California scratch-offs by odds, estimated ROI, remaining top prizes, and ticket price. 200X ranks as the best overall ticket, while Royal Jackpot has the best published odds of winning any prize, and Tripling Bonus Crossword leads tickets under $5.
 Maintained byJacob Dymond
Updated
Current leaders by goal before the full top-10 table.
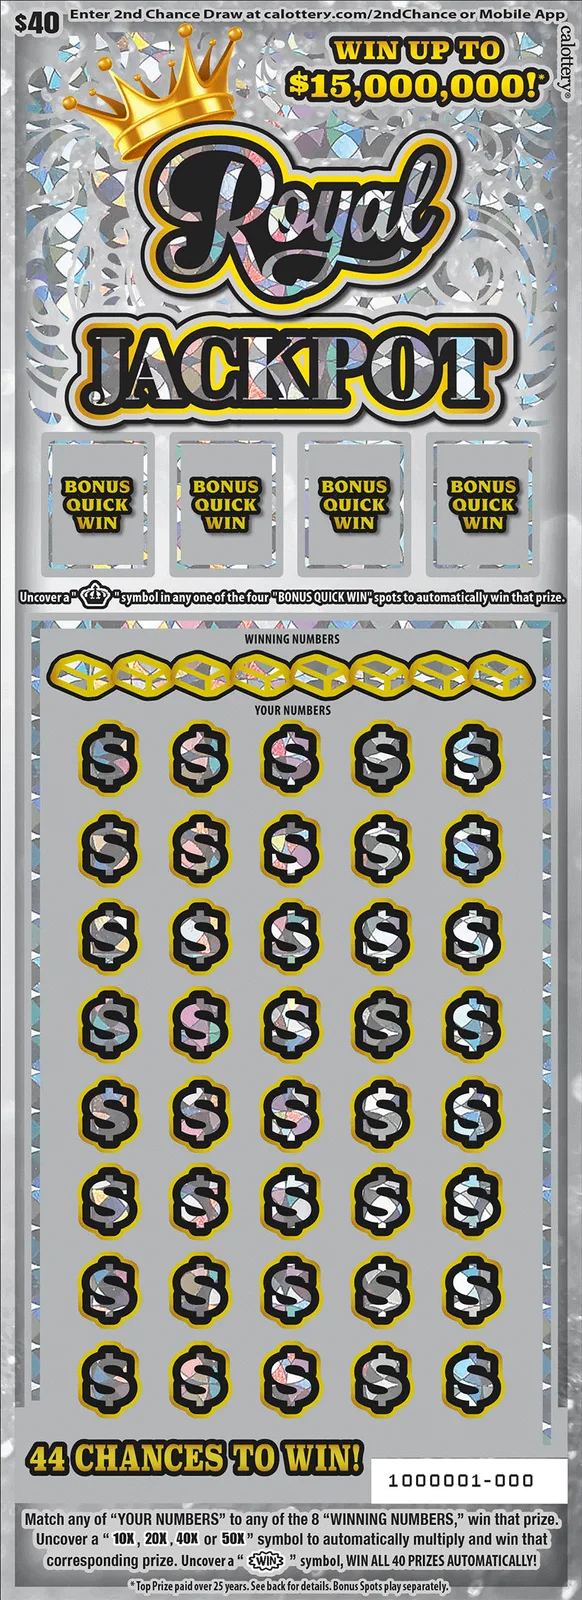
Royal Jackpot
$40Strongest published overall odds at 1 in 2.43, although many wins may only return the ticket price.
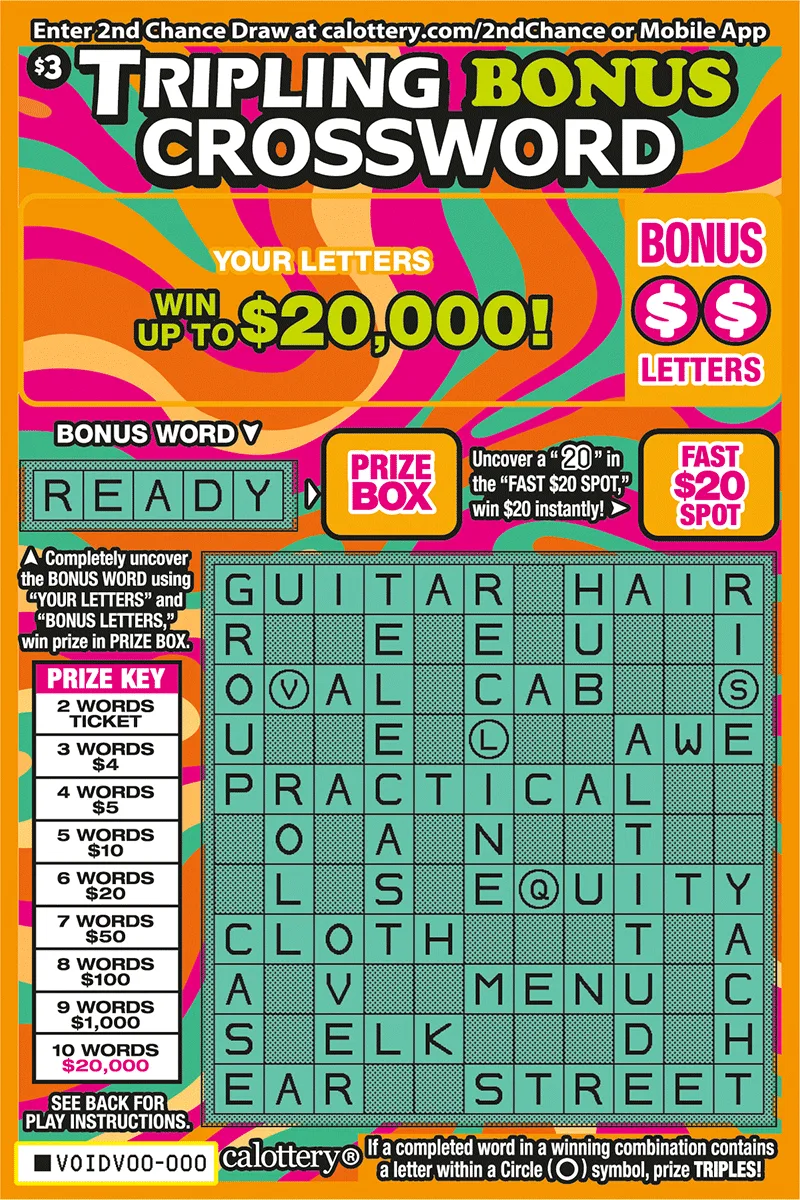
Tripling Bonus Crossword
$3Strongest composite ranking among tickets under $5.
Top 10 eligible tickets by composite ranking. Updated August 2, 2026.
| Rank | Game | Price | Top Prize | Overall Odds | Profit Odds | Est. ROI | Top Prizes Left | Why It Ranks |
|---|---|---|---|---|---|---|---|---|
| #1 | 200X | $30 | $10M | 1 in 2.71 | 1 in 4.94 | — | 5 of 5 | Strongest balance among eligible tickets based on profitable-prize odds of 1 in 4.94, 100% of original top prizes remaining. |
| #2 | Tripling Bonus Crossword | $3 | $20K | 1 in 3.34 | 1 in 4.13 | — | 13 of 20 | Ranks #2 with published overall odds of 1 in 3.34. |
| #3 | Neon Jackpot | $10 | $1M | 1 in 3.42 | 1 in 4.71 | — | 6 of 8 | Ranks #3 with published overall odds of 1 in 3.42. |
| #4 | Set for Life (#1705) | $20 | $5M | 1 in 3.32 | 1 in 4.96 | — | 6 of 6 | Ranks #4 with published overall odds of 1 in 3.32. |
| #5 | Crossword Xtreme | $30 | $7M | 1 in 2.72 | 1 in 3.73 | — | 2 of 4 | Ranks #5 with published overall odds of 1 in 2.72. |
| #6 | Instant Prize Crossword (#1739) | $20 | $2M | 1 in 3.10 | 1 in 5.15 | — | 15 of 15 | Ranks #6 with published overall odds of 1 in 3.10. |
| #7 | MONOPOLY (#1669) | $20 | $5M | 1 in 3.32 | 1 in 4.96 | — | 4 of 6 | Ranks #7 with published overall odds of 1 in 3.32. |
| #8 | 100X The Cash | $20 | $5M | 1 in 3.32 | 1 in 4.96 | — | 4 of 6 | Ranks #8 with published overall odds of 1 in 3.32. |
| #9 | $1,000,000 Poker | $10 | $1M | 1 in 3.50 | 1 in 4.41 | — | 7 of 12 | Ranks #9 with published overall odds of 1 in 3.50. |
| #10 | LOTERIA™ Extra! (#1737) | $5 | $100K | 1 in 3.51 | 1 in 5.38 | — | 13 of 13 | Ranks #10 with published overall odds of 1 in 3.51. |
Category rankings are more important than the composite score — pick the metric that matches how you want to play.
Royal Jackpot
$40Strongest published overall odds at 1 in 2.43, although many wins may only return the ticket price.
Alternative: 200X
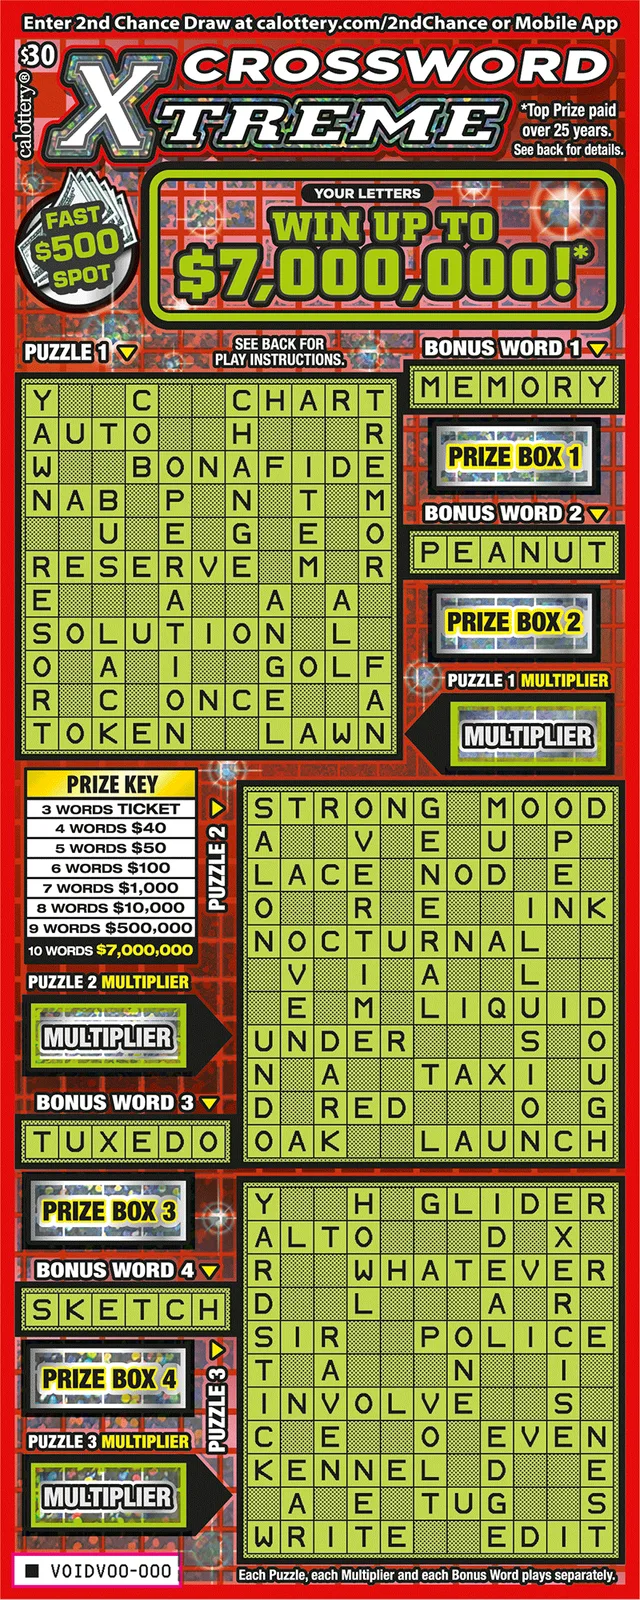
Crossword Xtreme
$30Best calculated odds of winning more than the ticket price (1 in 3.73).
Alternative: Tripling Bonus Crossword
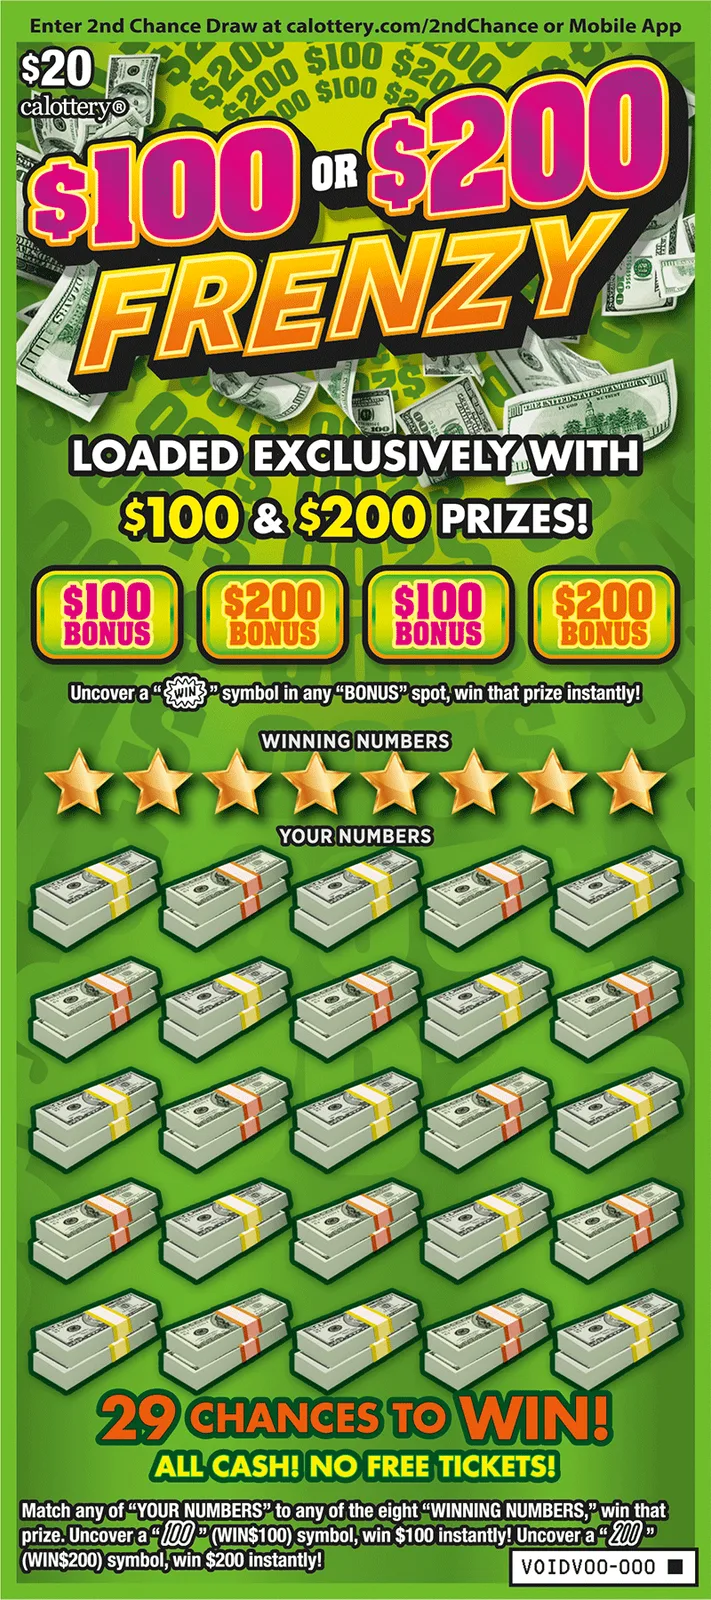
$100 or $200 Frenzy
$20Most top prizes still unclaimed (334933 of 467736).
Alternative: $50 or $100
One primary winner per price band, with a short compare of nearby tickets — not a full reprint of the database.
Overall odds: 1 in 3.34
Best estimated return among active $1 to $3 games on the composite ranking.
| Game | Price | Overall Odds | Est. ROI | Top Prizes Left |
|---|---|---|---|---|
| Tripling Bonus Crossword | $3 | 1 in 3.34 | — | 13 |
| Fireball Bingo | $3 | 1 in 3.61 | — | 31 |
| LOTERIA™ | $3 | 1 in 3.74 | — | 32 |
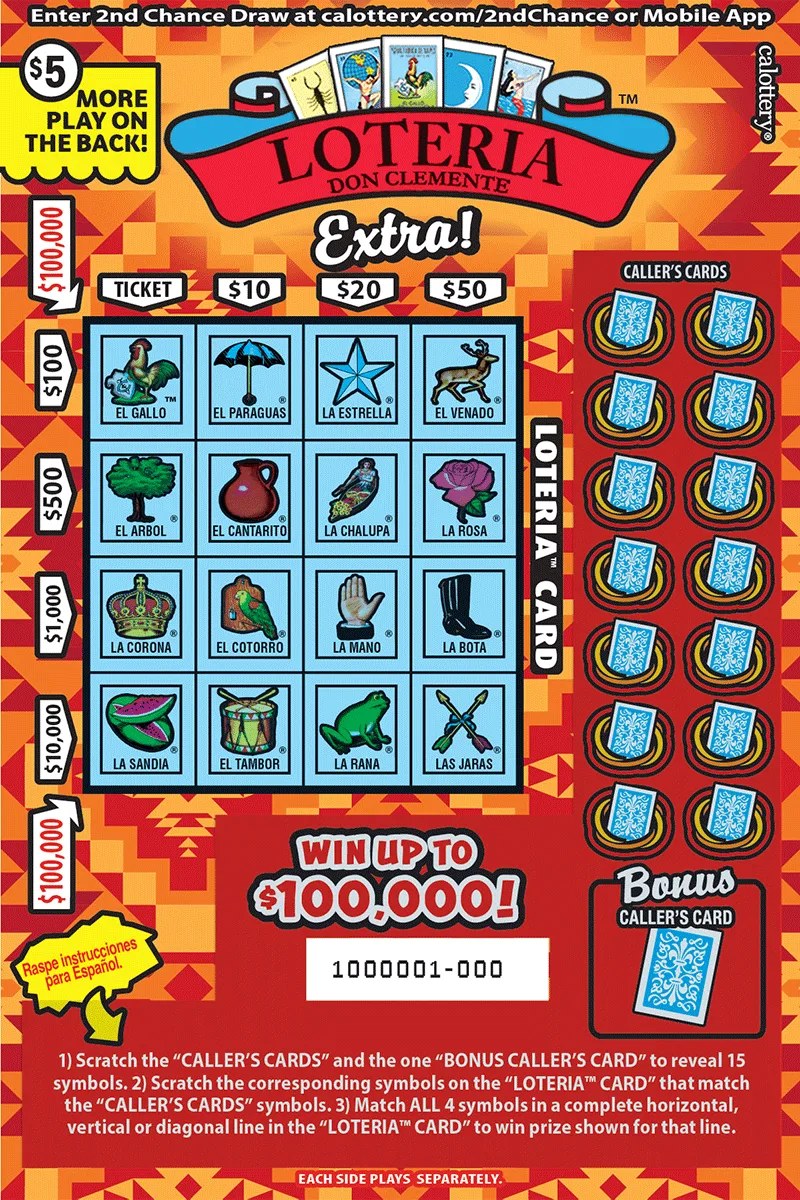
Overall odds: 1 in 3.51
Best estimated return among active $5 games on the composite ranking.
| Game | Price | Overall Odds | Est. ROI | Top Prizes Left |
|---|---|---|---|---|
| LOTERIA™ Extra! (#1737) | $5 | 1 in 3.51 | — | 13 |
| Red, White & Blue 7's | $5 | 1 in 4.73 | — | 12 |
| SuperLotto Plus® Multiplier | $5 | 1 in 3.81 | — | 11 |
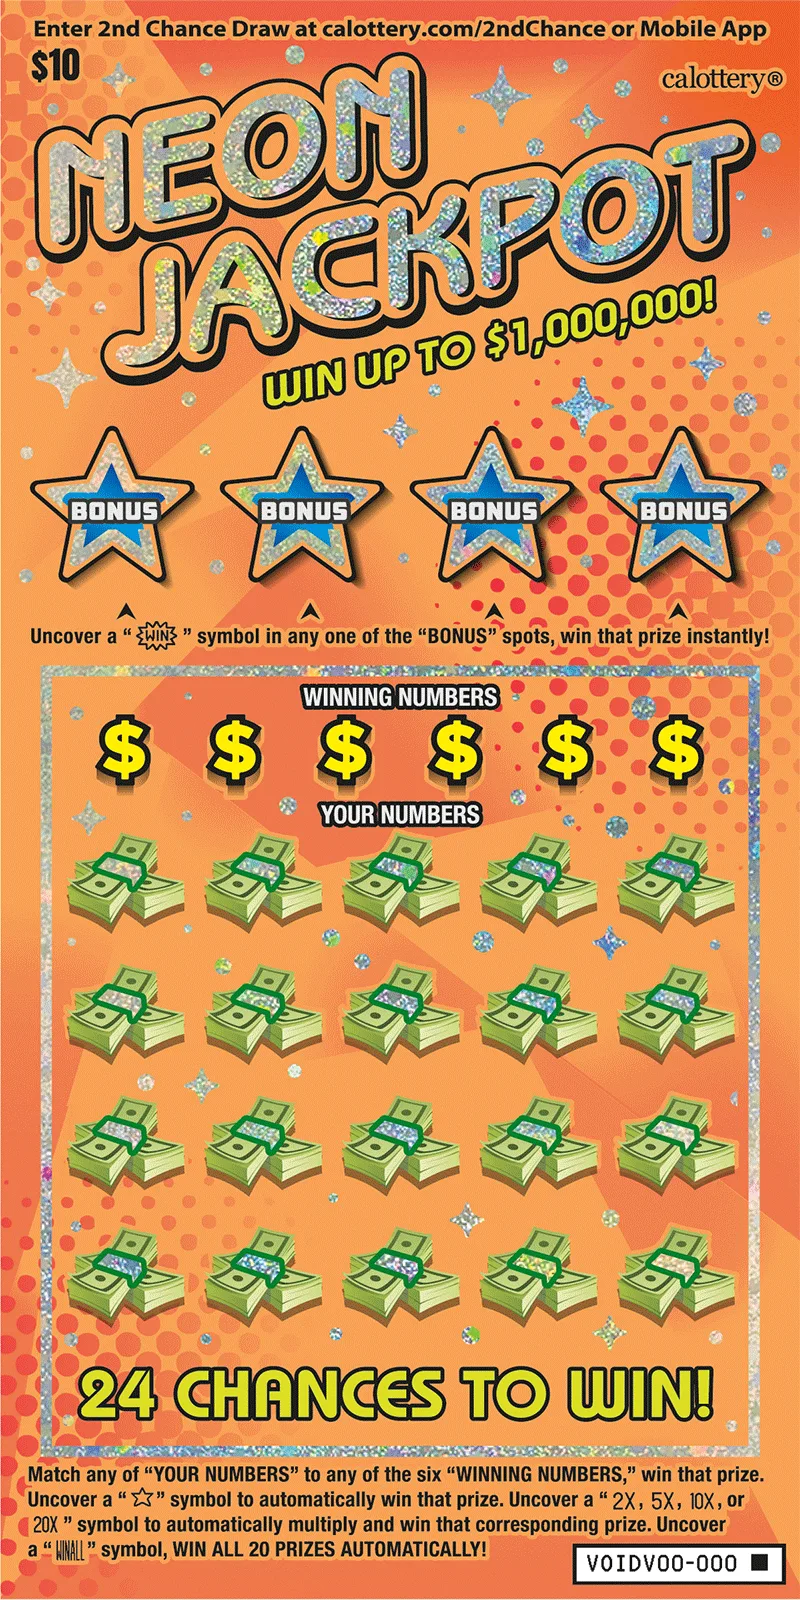
Overall odds: 1 in 3.42
Best estimated return among active $10 games on the composite ranking.
| Game | Price | Overall Odds | Est. ROI | Top Prizes Left |
|---|---|---|---|---|
| Neon Jackpot | $10 | 1 in 3.42 | — | 6 |
| $1,000,000 Poker | $10 | 1 in 3.50 | — | 7 |
| LOTERIA™ Grande | $10 | 1 in 3.50 | — | 3 |
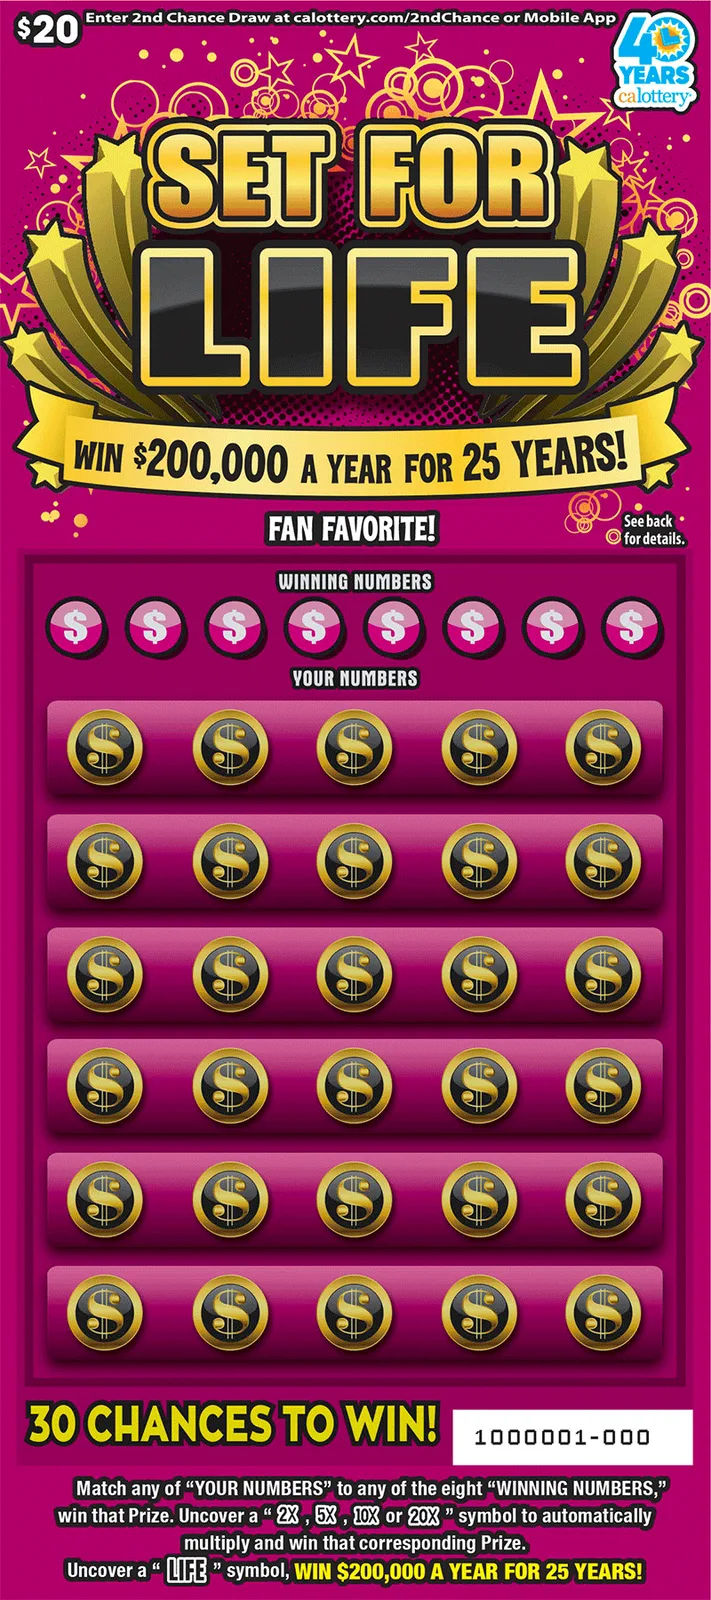
Overall odds: 1 in 3.32
Best estimated return among active $20 games on the composite ranking.
| Game | Price | Overall Odds | Est. ROI | Top Prizes Left |
|---|---|---|---|---|
| Set for Life (#1705) | $20 | 1 in 3.32 | — | 6 |
| Instant Prize Crossword (#1739) | $20 | 1 in 3.10 | — | 15 |
| MONOPOLY (#1669) | $20 | 1 in 3.32 | — | 4 |
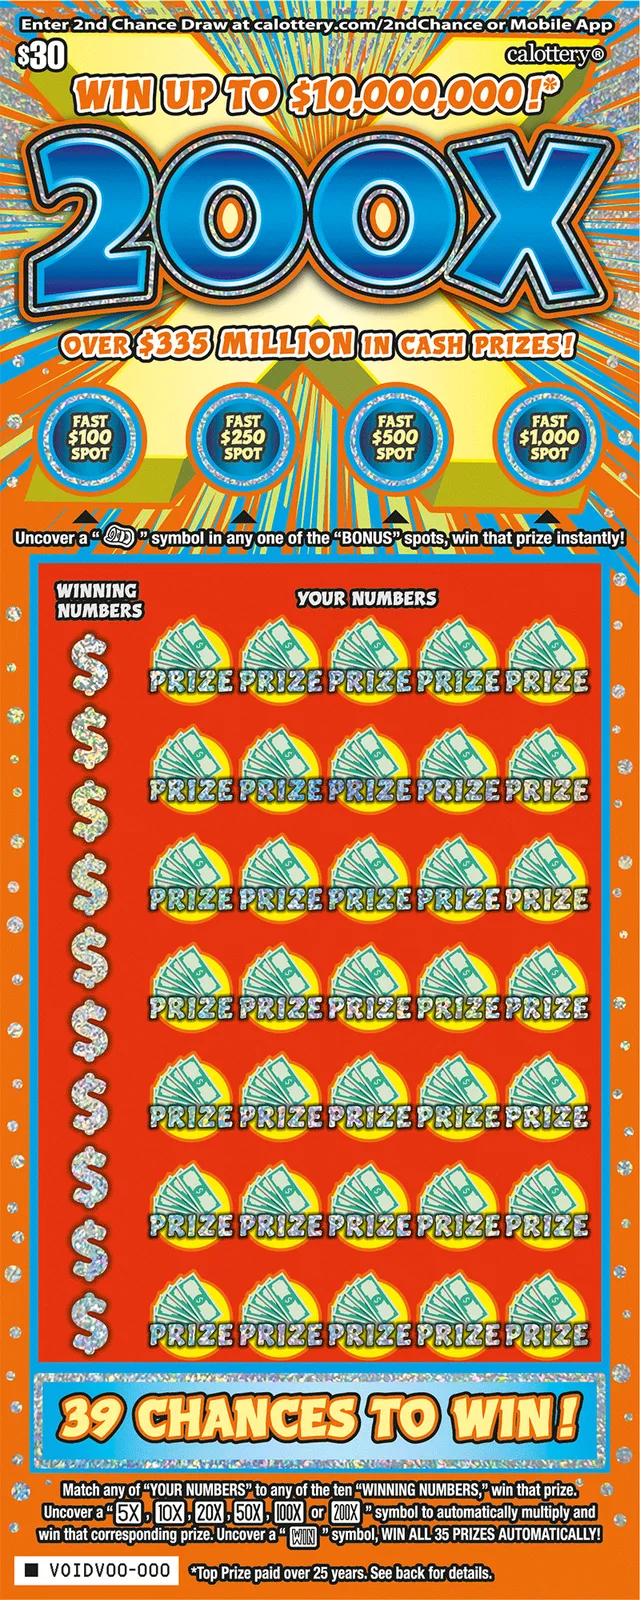
Overall odds: 1 in 2.71
Best estimated return among active $30 to $50 games on the composite ranking.
| Game | Price | Overall Odds | Est. ROI | Top Prizes Left |
|---|---|---|---|---|
| 200X | $30 | 1 in 2.71 | — | 5 |
| Crossword Xtreme | $30 | 1 in 2.72 | — | 2 |
| 7's | $30 | 1 in 2.71 | — | 2 |
These eligible games currently compare less favorably on ranking metrics. That is not advice to avoid them forever — prize pools change as tickets are claimed.
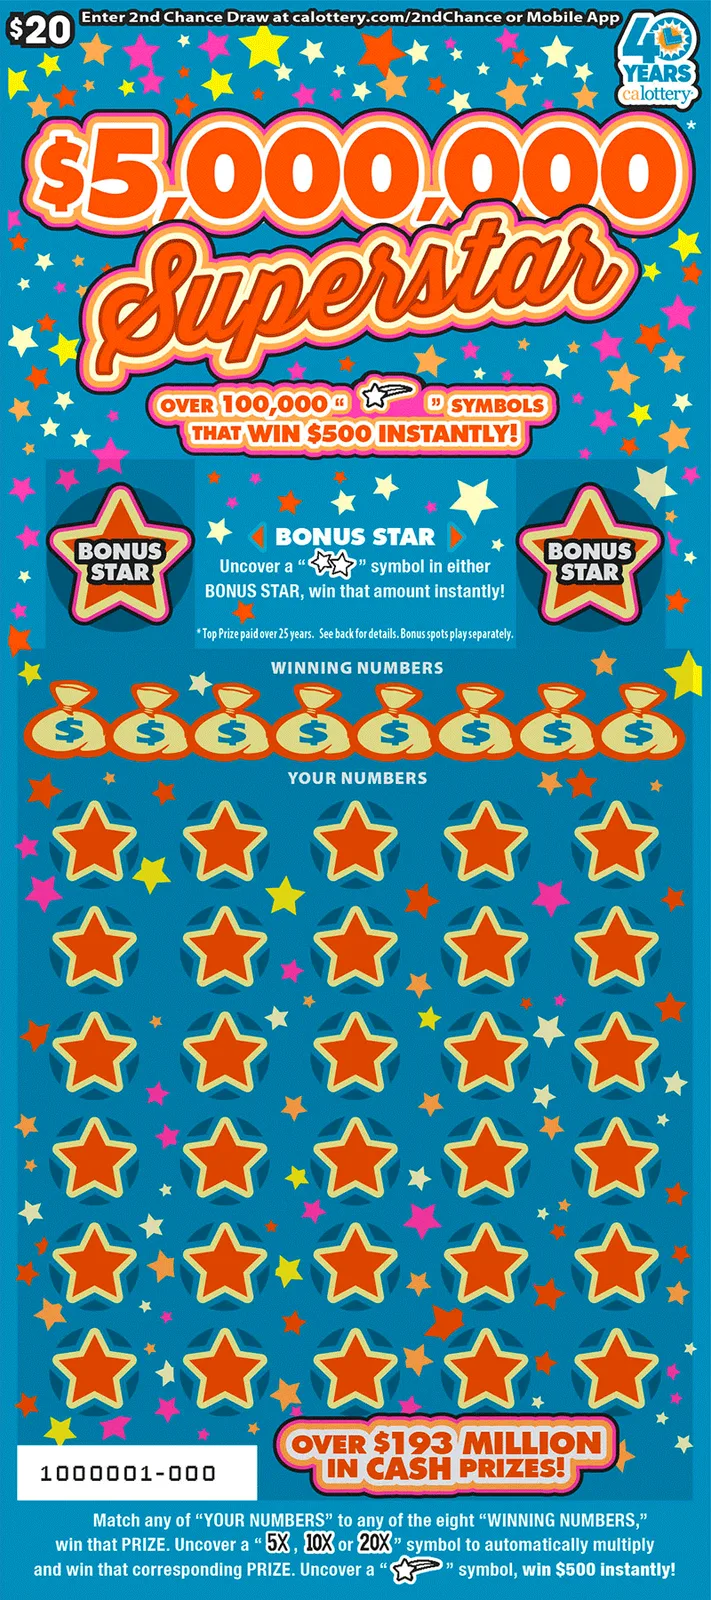
$5,000,000 Superstar
$20Currently ranks #43 among eligible tickets with a lower composite score than most peers.
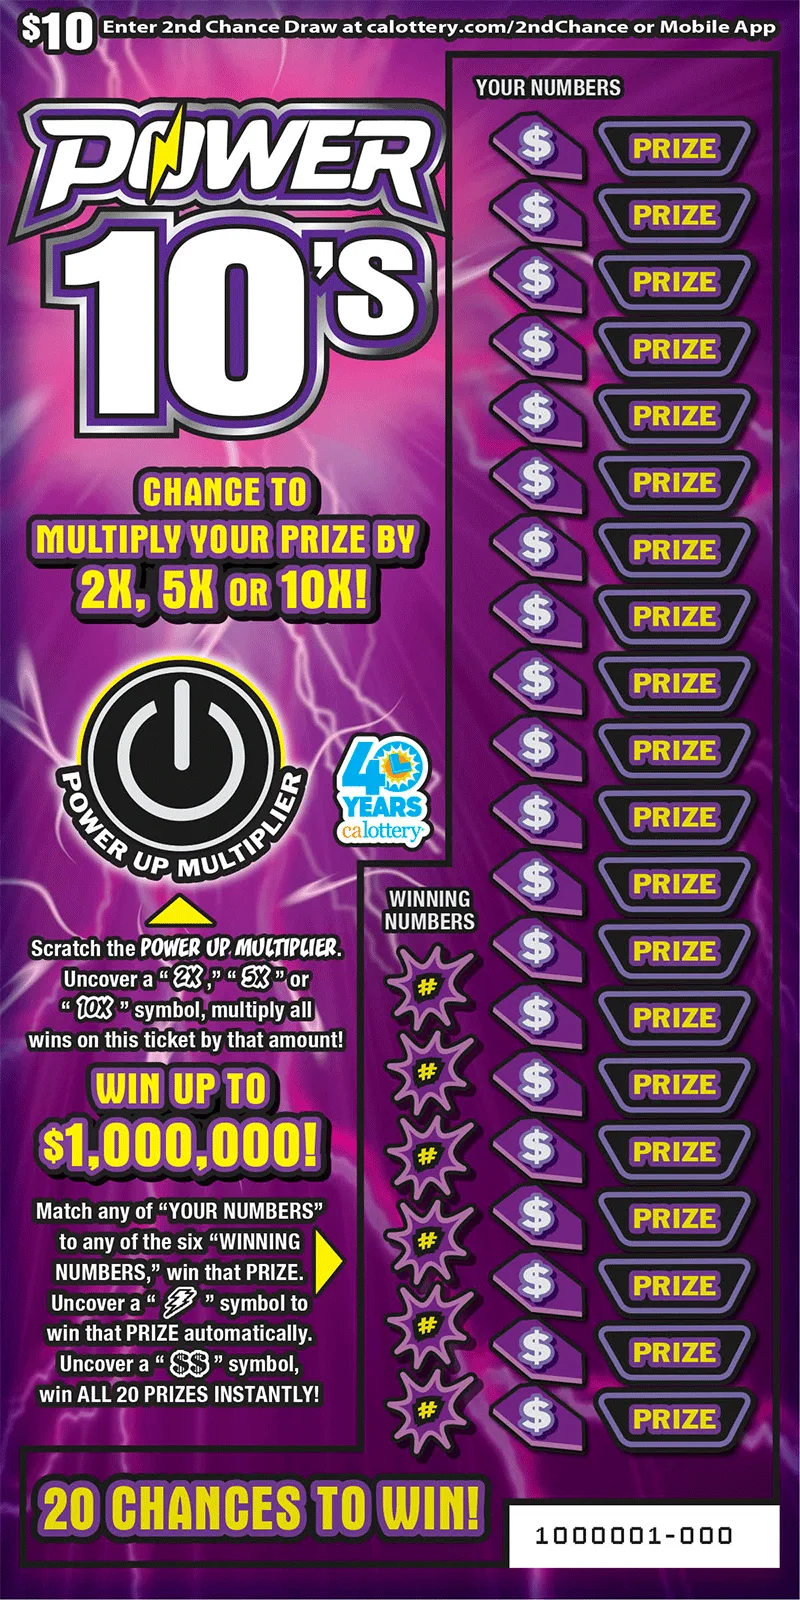
Power 10's
$10Currently ranks #44 among eligible tickets with a lower composite score than most peers.
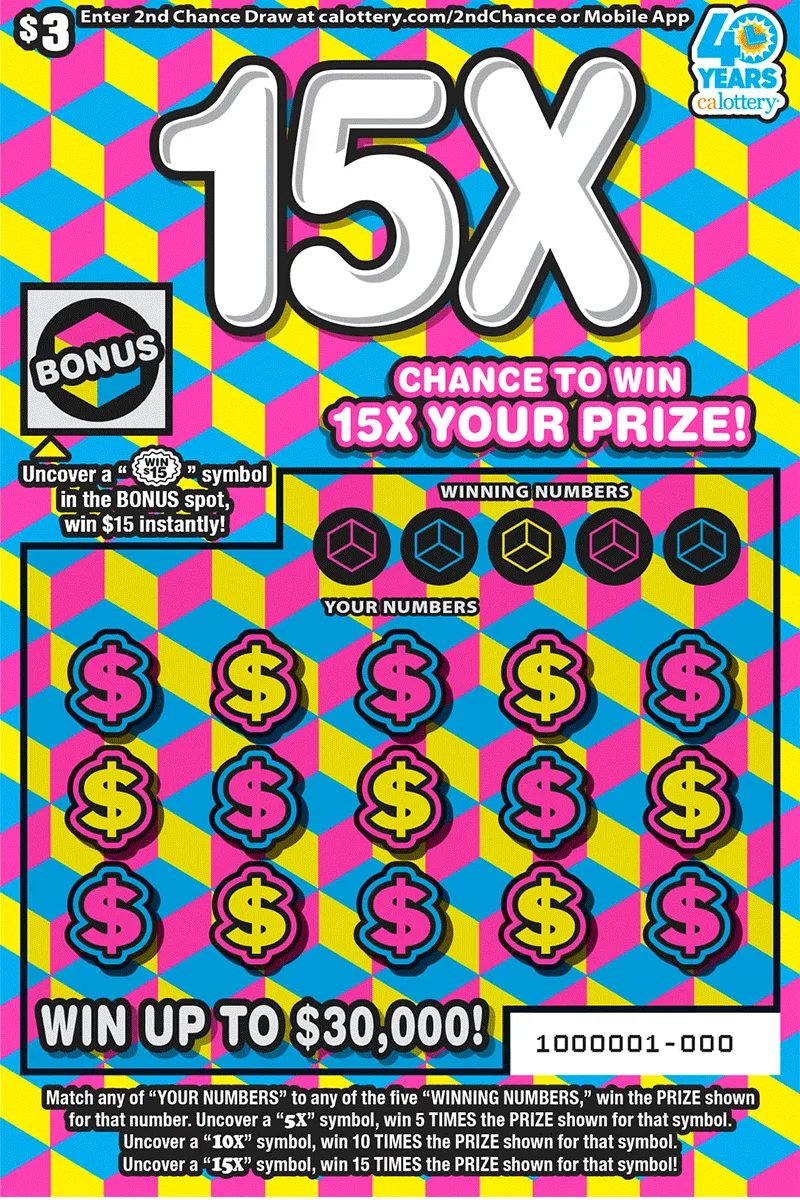
15X
$3Currently ranks #45 among eligible tickets with a lower composite score than most peers.
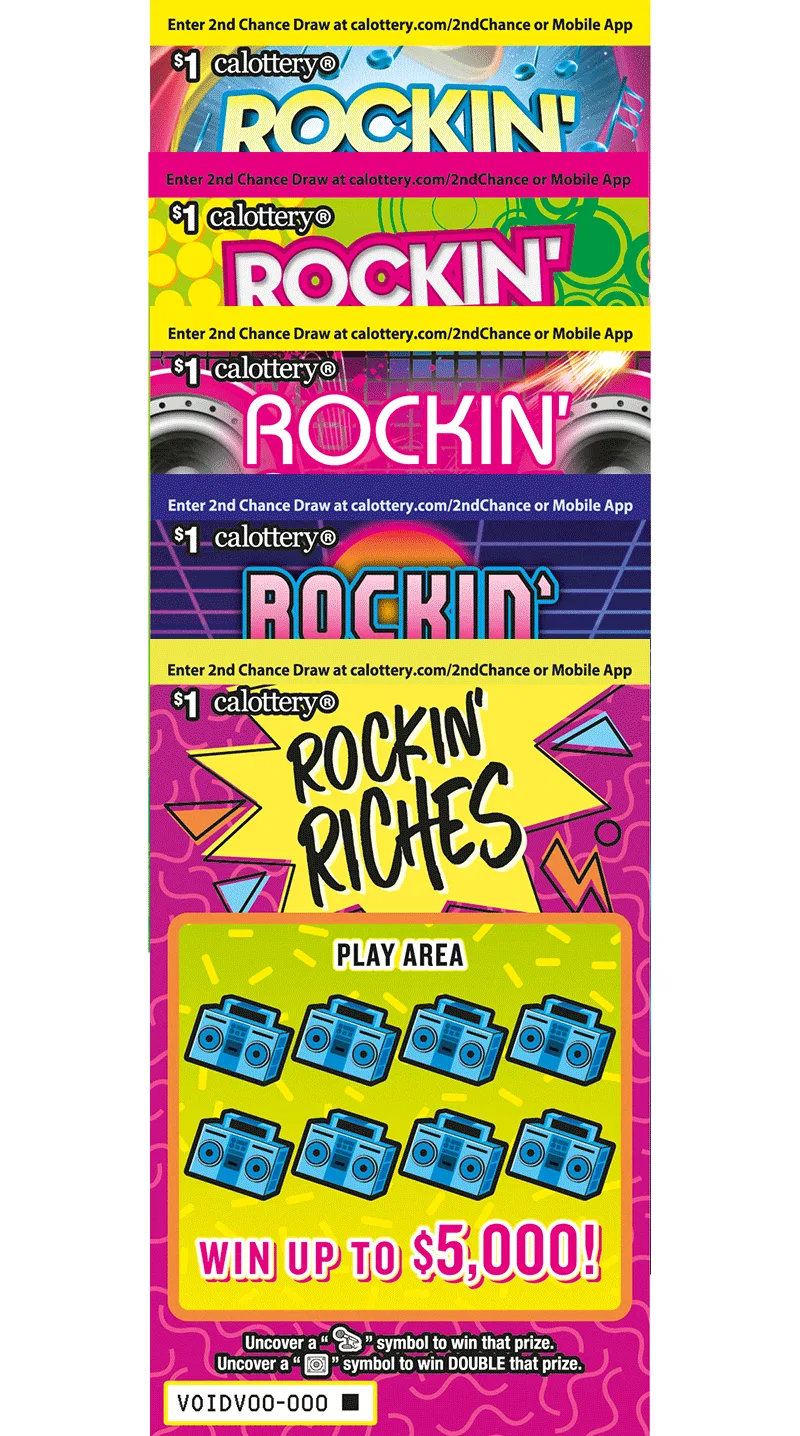
Rockin' Riches
$1Currently ranks #46 among eligible tickets with a lower composite score than most peers.
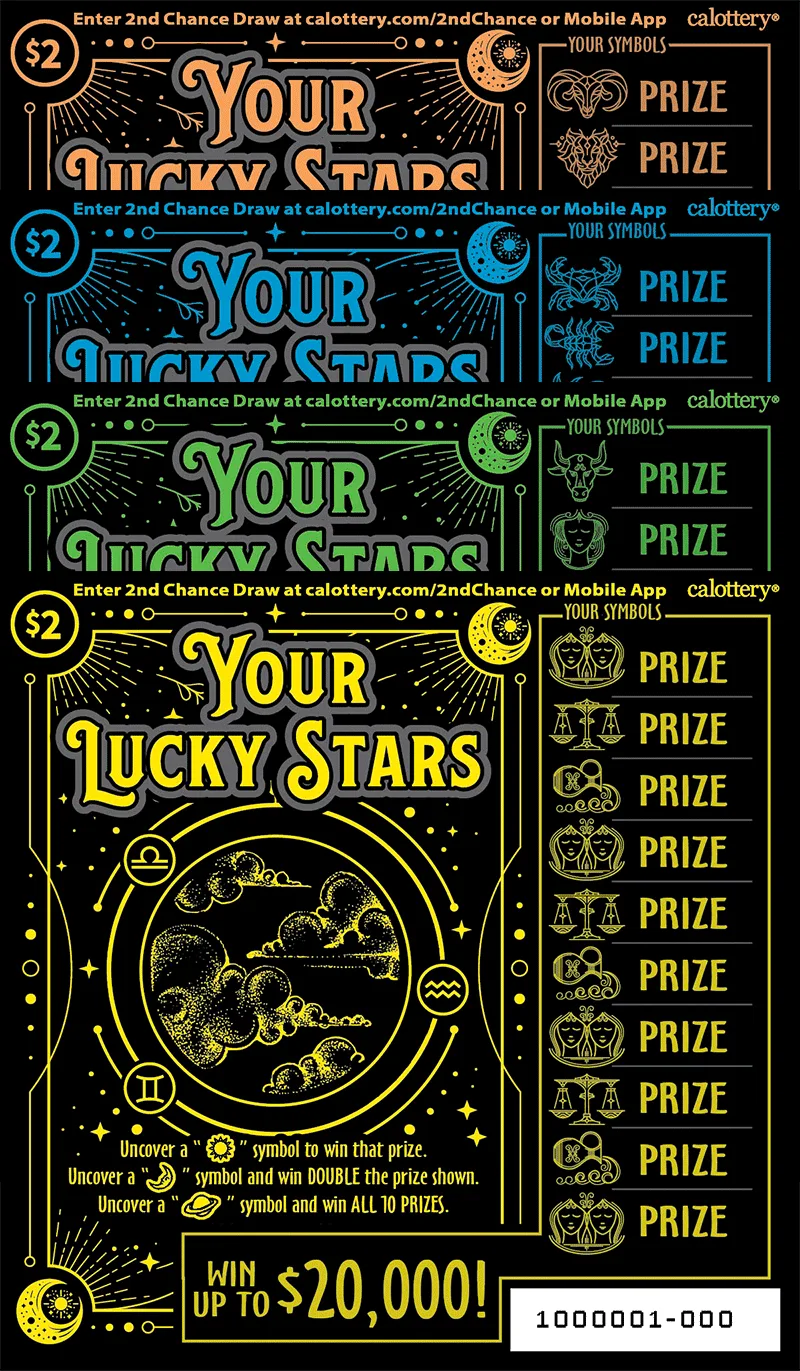
Your Lucky Stars
$2Currently ranks #47 among eligible tickets with a lower composite score than most peers.
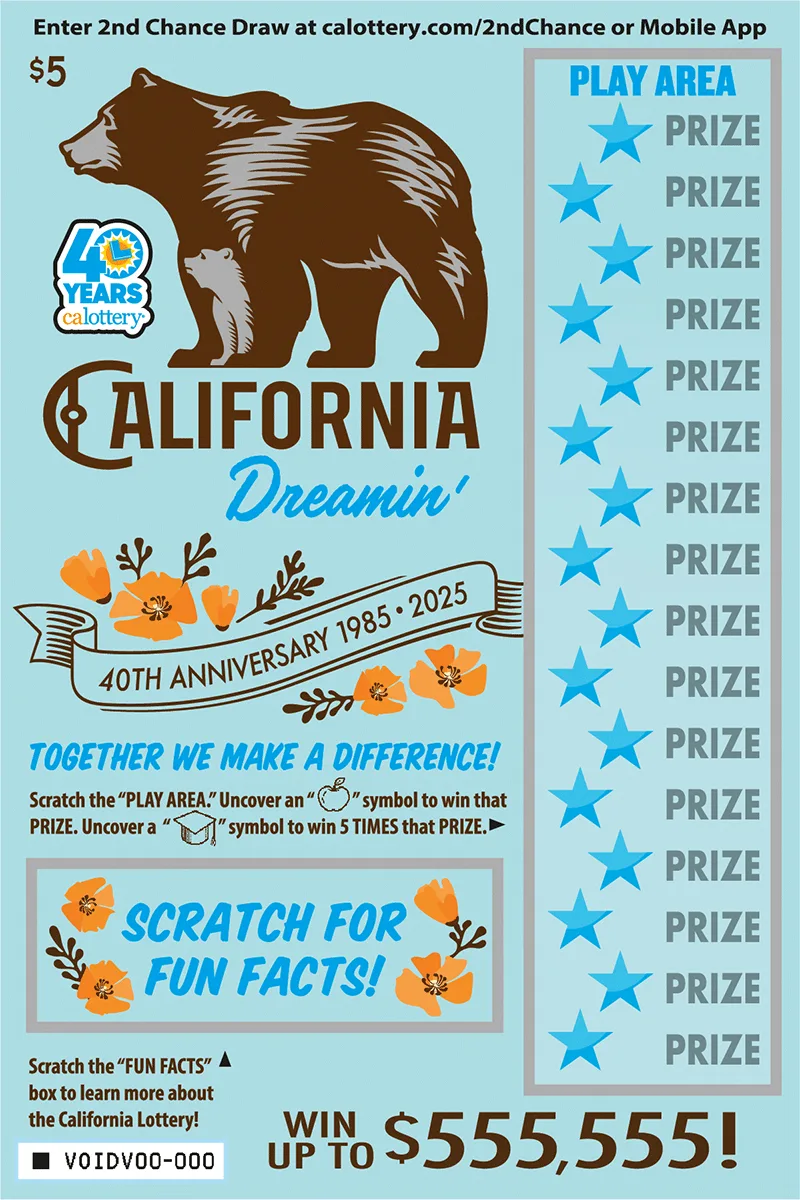
California Dreamin'
$5Currently ranks #48 among eligible tickets with a lower composite score than most peers.
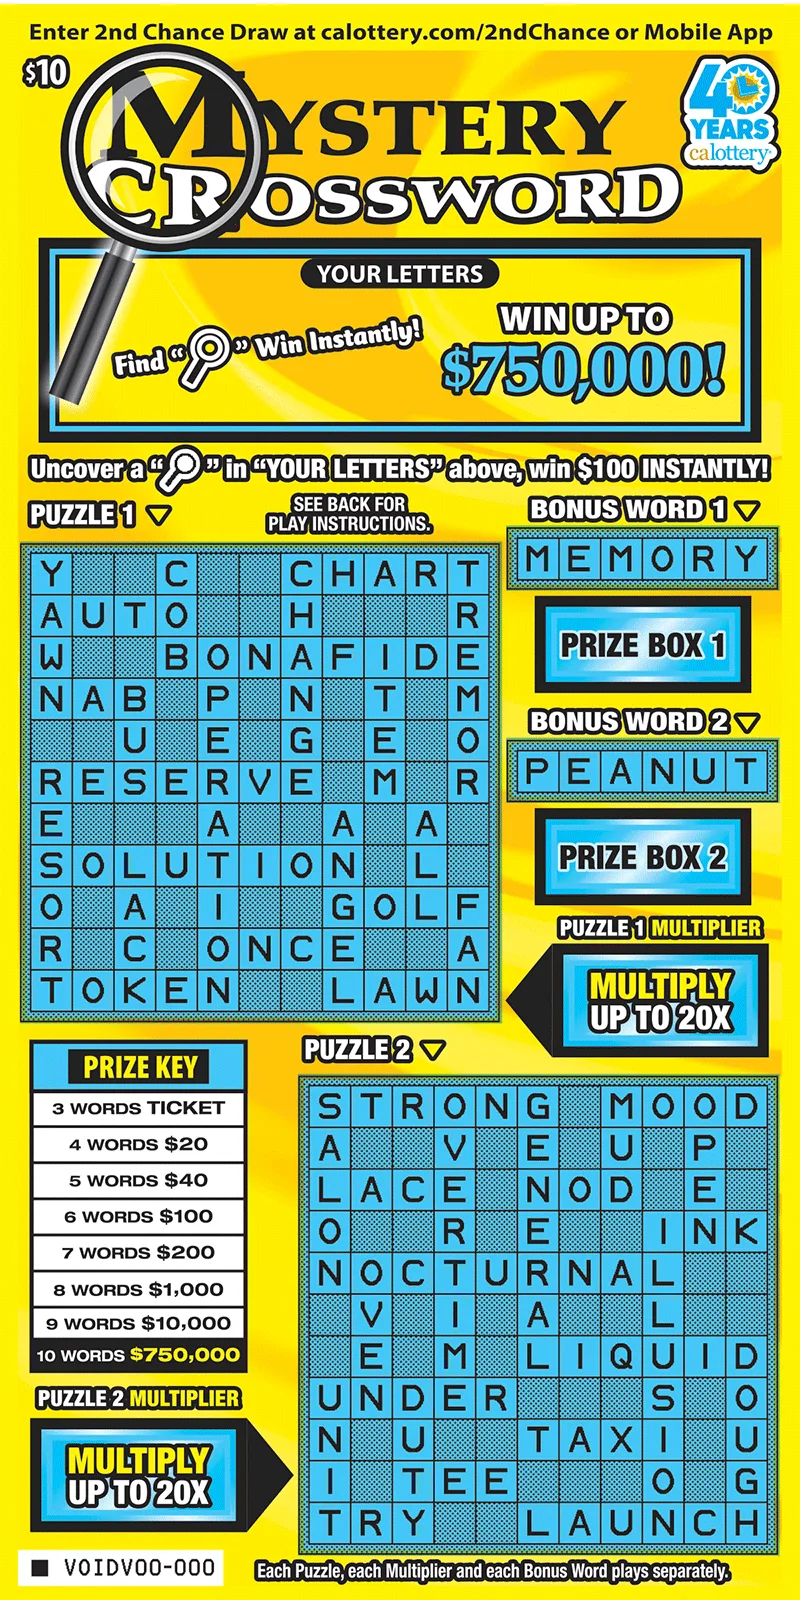
Mystery Crossword (#1708)
$10Currently ranks #49 among eligible tickets with a lower composite score than most peers.
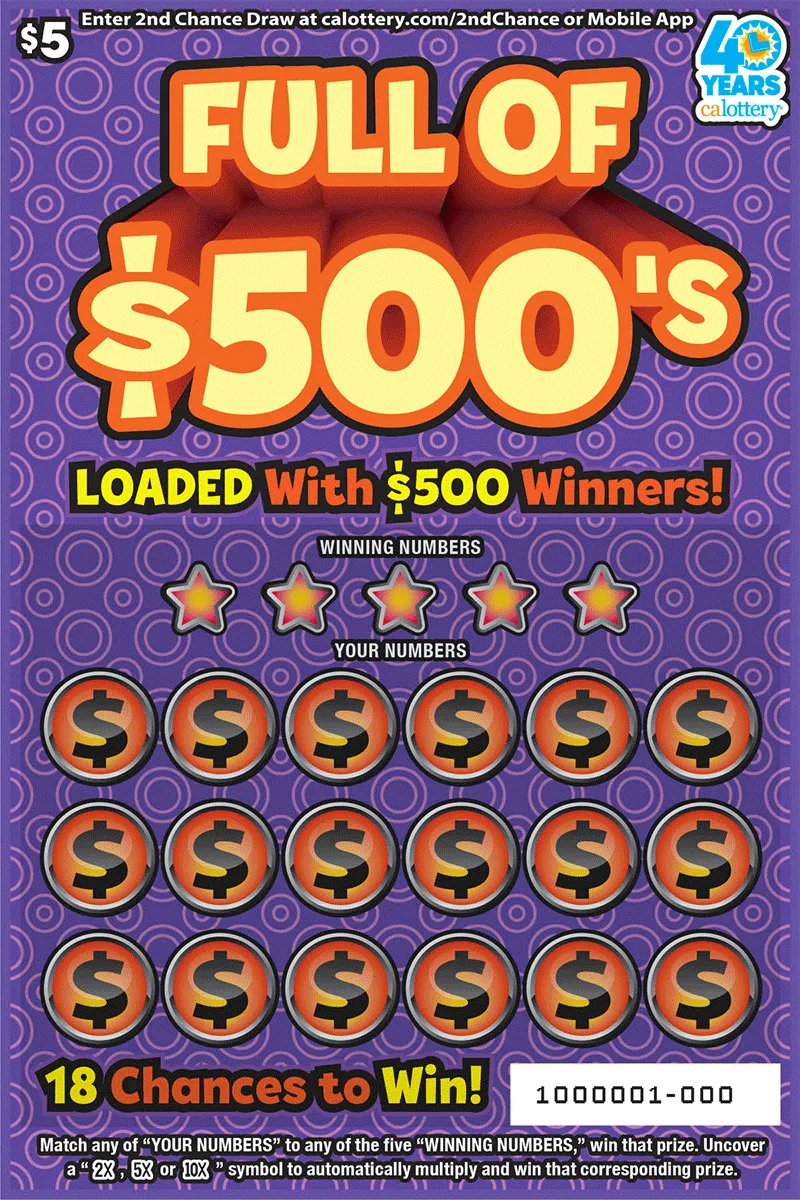
Full of 500's
$5Currently ranks #50 among eligible tickets with a lower composite score than most peers.
All 57 eligible games in the current ranking.
| Rank | Game | Price | Overall Odds | Profit Odds | Est. ROI | Top Prizes Left |
|---|---|---|---|---|---|---|
| #1 | 200X | $30 | 1 in 2.71 | 1 in 4.94 | — | 5 |
| #2 | Tripling Bonus Crossword | $3 | 1 in 3.34 | 1 in 4.13 | — | 13 |
| #3 | Neon Jackpot | $10 | 1 in 3.42 | 1 in 4.71 | — | 6 |
| #4 | Set for Life (#1705) | $20 | 1 in 3.32 | 1 in 4.96 | — | 6 |
| #5 | Crossword Xtreme | $30 | 1 in 2.72 | 1 in 3.73 | — | 2 |
| #6 | Instant Prize Crossword (#1739) | $20 | 1 in 3.10 | 1 in 5.15 | — | 15 |
| #7 | MONOPOLY (#1669) | $20 | 1 in 3.32 | 1 in 4.96 | — | 4 |
| #8 | 100X The Cash | $20 | 1 in 3.32 | 1 in 4.96 | — | 4 |
| #9 | $1,000,000 Poker | $10 | 1 in 3.50 | 1 in 4.41 | — | 7 |
| #10 | LOTERIA™ Extra! (#1737) | $5 | 1 in 3.51 | 1 in 5.38 | — | 13 |
| #11 | LOTERIA™ Grande | $10 | 1 in 3.50 | 1 in 4.44 | — | 3 |
| #12 | California Color Pop | $10 | 1 in 3.50 | 1 in 4.44 | — | 3 |
| #13 | Red, White & Blue 7's | $5 | 1 in 4.73 | 1 in 4.63 | — | 12 |
| #14 | 7's | $30 | 1 in 2.71 | 1 in 4.95 | — | 2 |
| #15 | SuperLotto Plus® Multiplier | $5 | 1 in 3.81 | 1 in 5.31 | — | 11 |
| #16 | Fireball Bingo | $3 | 1 in 3.61 | 1 in 5.12 | — | 31 |
| #17 | Cash Crush | $5 | 1 in 4.53 | 1 in 4.54 | — | 8 |
| #18 | Red Carpet Riches | $20 | 1 in 3.10 | 1 in 5.15 | — | 6 |
| #19 | Royal Jackpot | $40 | 1 in 2.43 | 1 in 5.86 | — | 3 |
| #20 | California Jackpot | $10 | 1 in 3.42 | 1 in 4.71 | — | 3 |
| #21 | $1,000,000 Money Mania | $10 | 1 in 3.42 | 1 in 4.71 | — | 4 |
| #22 | Show Me $5,000,000! | $20 | 1 in 3.32 | 1 in 4.96 | — | 2 |
| #23 | LOTERIA™ | $3 | 1 in 3.74 | 1 in 5.80 | — | 32 |
| #24 | Instant Prize Crossword (#1590) | $20 | 1 in 3.10 | 1 in 5.14 | — | 9 |
| #25 | JAWS | $5 | 1 in 3.81 | 1 in 5.31 | — | 12 |
| #26 | 100X | $20 | 1 in 3.00 | 1 in 5.99 | — | 3 |
| #27 | MEGA Crossword | $5 | 1 in 3.82 | 1 in 5.80 | — | 21 |
| #28 | Double The Luck | $20 | 1 in 3.67 | 1 in 5.78 | — | 2 |
| #29 | Golden State Riches | $20 | 1 in 2.89 | 1 in 8.93 | — | 6 |
| #30 | Cash King | $20 | 1 in 3.00 | 1 in 5.99 | — | 2 |
| #31 | GOOOAAAL! | $2 | 1 in 4.09 | 1 in 6.96 | — | 14 |
| #32 | Dominoes | $2 | 1 in 4.10 | 1 in 6.89 | — | 10 |
| #33 | Poker Nights | $5 | 1 in 3.62 | 1 in 5.32 | — | 9 |
| #34 | Ca$h Doubler | $2 | 1 in 4.24 | 1 in 7.43 | — | 11 |
| #35 | Set for Life (#1736) | $2 | 1 in 4.44 | 1 in 7.98 | — | 2 |
| #36 | LOTERIA™ Extra! (#1688) | $5 | 1 in 3.51 | 1 in 5.38 | — | 3 |
| #37 | MONOPOLY (#1665) | $2 | 1 in 4.10 | 1 in 6.89 | — | 15 |
| #38 | LOTERIA™ | $3 | 1 in 3.74 | 1 in 5.80 | — | 14 |
| #39 | $pring Green | $2 | 1 in 4.25 | 1 in 6.30 | — | 7 |
| #40 | $50 or $100 | $10 | 1 in 8.13 | 1 in 8.11 | — | 265909 |
| #41 | 40 Years of Play! | $40 | 1 in 2.85 | 1 in 6.66 | — | 1 |
| #42 | $100 or $200 Frenzy | $20 | 1 in 7.94 | 1 in 7.92 | — | 334933 |
| #43 | $5,000,000 Superstar | $20 | 1 in 3.43 | 1 in 6.34 | — | 1 |
| #44 | Power 10's | $10 | 1 in 3.30 | 1 in 6.09 | — | 1 |
| #45 | 15X | $3 | 1 in 3.78 | 1 in 5.90 | — | 5 |
| #46 | Rockin' Riches | $1 | 1 in 4.34 | 1 in 8.17 | — | 65 |
| #47 | Your Lucky Stars | $2 | 1 in 4.09 | 1 in 6.96 | — | 6 |
| #48 | California Dreamin' | $5 | 1 in 3.75 | 1 in 7.70 | — | 5 |
| #49 | Mystery Crossword (#1708) | $10 | 1 in 3.47 | 1 in 7.61 | — | 11 |
| #50 | Full of 500's | $5 | 1 in 4.43 | 1 in 5.96 | — | 2038 |
| #51 | 10X The Cash | $2 | 1 in 4.16 | 1 in 7.16 | — | 4 |
| #52 | Mystery Crossword (#1659) | $10 | 1 in 3.47 | 1 in 7.58 | — | 1 |
| #53 | Four Leaf Frenzy | $1 | 1 in 4.56 | 1 in 7.55 | — | 6 |
| #54 | Winner Winner Chicken Dinner | $5 | 1 in 4.77 | 1 in 7.37 | — | 2 |
| #55 | Straight 8's | $1 | 1 in 4.59 | 1 in 8.79 | — | 24 |
| #56 | The Lucky Spot! | $1 | 1 in 4.78 | 1 in 8.48 | — | 27 |
| #57 | $100 or $200 | $20 | 1 in 7.94 | 1 in 7.92 | — | 72422 |
Answers about the best California scratch-offs to buy, odds, price tiers, and how rankings work.
As of August 2, 2026, 200X ranks as the best overall California scratch-off among 57 eligible games. Strongest balance among eligible tickets based on profitable-prize odds of 1 in 4.94, 100% of original top prizes remaining. These rankings do not guarantee a win or profit.
Royal Jackpot currently has the best published overall odds at 1 in 2.43. Overall odds count any prize as a win, including prizes equal to the ticket price, so they do not necessarily mean the best chance of making a profit.
$100 or $200 Frenzy currently shows the most top prizes remaining (334933 of 467736). Raw remaining counts are not the same as current top-prize odds.
LOTERIA™ Extra! (#1737) currently leads the $5 tier.
Neon Jackpot currently leads the $10 tier.
Not automatically. Higher-priced tickets often have different prize structures and may show stronger published overall odds, but expected value and remaining top prizes vary by game. Compare odds, ROI where available, and prize availability inside each price tier.
Newer games can have more intact prize pools, but a recent launch does not guarantee better ROI or better odds than an older eligible game. Treat “best new” as its own category, not a substitute for expected value.
Eligible active games with at least one top prize remaining and enough published odds or prize-tier data are ranked by category (overall odds, profitable-prize odds, estimated ROI, top prizes remaining, large-prize availability, and newest) and by a composite score when multiple metrics are available. Games with all top prizes claimed, or games where the California Lottery does not publish remaining-prize data, stay in the full scratch-off database but are excluded from rankings. Official lottery data is labeled separately from Lottery Valley calculations. See the methodology section on this page for weights and limitations.
Rankings refresh when underlying California Lottery game and prize data change in Lottery Valley’s database. The date shown on this page reflects the latest game data used for the ranking, not a live feed of every claim.
No. Scratch-off games are random. Stronger comparative metrics improve how tickets compare to each other on published data; they do not identify winning tickets or guarantee a prize or profit.
Published California Lottery game pages, overall odds, ticket prices, top prizes, and top-prizes-remaining figures where available.
Games must be active or ending, have at least one top prize remaining, and include enough published odds or prize-tier data to support ranking. Games with all top prizes claimed, and games where the California Lottery does not publish remaining prize data, stay on the full scratch-off database but are excluded from rankings. Ended and coming-soon games are listing-only as well.
When inputs are available: 45% estimated-ROI percentile, 25% profitable-prize-odds percentile, 20% top-prize-availability percentile, 10% published overall-odds percentile. Missing inputs redistribute weight across remaining metrics. Large prize means ≥$100,000.
Rankings follow this published methodology and are not changed by affiliate relationships. Data analysis by Lottery Valley; reviewed by Jacob Dymond, Founder and Editor.
Overall odds show how often any prize appears across the printed ticket pool. A prize equal to the ticket price may count as a win, so the best overall odds do not necessarily mean the best chance of making a profit.
Calculated from prize tiers where the prize amount is greater than the ticket price, when full tier odds are published.
Stored expected-return figures where available. Labeled estimated when inventory assumptions are involved.
Raw remaining counts and the share of original top prizes still available. That is top-prize availability — not the same as current top-prize odds, which require remaining ticket inventory.
Rankings cannot identify winning ticket locations or change the randomness of scratch-off games. 18+ only.
Next steps
Use this ranking for purchase decisions, then open the full ticket list or broader California lottery pages.
Browse every tracked ticket by price, odds, top prize, and remaining prizes.
Switch to draw games when you want rules, prizes, and schedules instead.
Return to the state overview for jackpots, results, and broader lottery tools.
Responsible play
Lottery draws are chance-based. Predictions, generators, and strategy content do not guarantee winnings — and age or access rules depend on local law and the official operator.
If gambling stops feeling fun, free confidential support is available in United States. The helpline beside this section is a good place to start.
Lottery Valley is an independent publisher, not a lottery operator.